 Graziano & Raulin
Research Methods (9th edition)
Probability
Probability is the basis of virtually every game of chance and every inferential statistical procedure ever developed. The best poker players can tell you the probability of each possible move and will adjust their decisions, including their bets, based on their assessment of probabilities. People who are skilled at playing games based on dice will also make such probability-based decisions.
We will start our discussion of probability by using dice because the number of outcomes is relatively small. Consequently, we can work through the concepts of probability without having to introduce complex mathematics.
Playing with Dice
A single die (singular of dice) is a cube with six equal sized sides, each with a different number on the side (from 1 to 6). If it is an honest die, each of the six numbers has an equal chance of coming up on a given roll.
A die will be honest if the density of the die is consistent. If you drill a little hole on one side and insert something heavy, like lead, into the hole, that side of the die will tend to land on the bottom, and the opposite side of the die will tend to show. If you do that to two dice, we say the dice are "loaded." Now you learned something that has nothing to do with statistics, but at least is interesting.
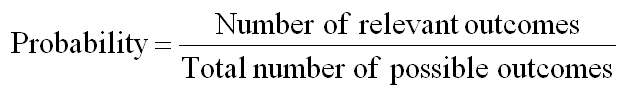
Probability is defined as the ratio of relevant outcomes divided by the total number of possible outcomes, as shown in the following equation. With our die, the probability of rolling a 1 is equal to 1 divided by 6, because one of the six sides has a 1 on it and all sides are equally probable, unless of course the die is loaded.
If the die is properly constructed, the probability of each number is indeed 1 in 6. But suppose that the die had the numbers 1 through 5 on five of the sides and another 1 on the sixth side. Then the probability of rolling a 1 is 2 in 6, because there are two ways to roll a 1 out of the six equally likely sides. In fact, we could print a 1 on all six sides, and thus the probability of rolling a 1 with that die would be 6 out of 6.
Probabilities are expressed either in this manner, or as a fraction (e.g., `1/6) or as a proportion from 0 to 1.00 (e.g., .1667). Probabilities are traditionally expressed as fractions or proportions, which can easily be used on mathematical computations. We could graph the probability of each of the possible outcomes in a simple bar graph, as shown below. We have graphed the probability for a standard die and for our die that has no 6, but two 1s.
Each of these graphs represent a distribution of probabilities, with the possible scores on the X-axis and the height of each bar representing the probability of that outcome.
What if you are rolling two standard dice? Assuming again that they are honest dice, the probability of any one side coming up is the same as each of the other sides. But what is the probability of any combination, such as two 6s or a 4 and a 5?
The easiest way of illustrating this situation is to set up a table to show the possible outcomes. For each different number that might come up on the first die, there are six possibilities that might occur for the second die. That makes a total of 36 possibilities, all of which are illustrated in the table below, with the count (total of the two dice) listed in parentheses on the second line.
Possible Outcomes for the First Die |
|||||||
1 |
2 |
3 |
4 |
5 |
6 |
||
Possible
|
1 |
1, 1 (2) |
2, 1 (3) |
3, 1 (4) |
4, 1 (5) |
5, 1 (6) |
6, 1 (7) |
2 |
1, 2 (3) |
2, 2 (4) |
3, 2 (5) |
4, 2 (6) |
5, 2 (7) |
6, 2 (8) |
|
3 |
1,3 (4) |
2, 3 (5) |
3, 3 (6) |
4, 3 (7) |
5, 3 (8) |
6, 3 (9) |
|
4 |
1, 4 (5) |
2, 4 (6) |
3, 4 (7) |
4, 4 (8) |
5, 4 (9) |
6, 4 (10) |
|
5 |
1, 5 (6) |
2, 5 (7) |
3, 5 (8) |
4, 5 (9) |
5, 5 (10) |
6, 5 (11) |
|
6 |
1, 6 (7) |
2, 6 (8) |
3, 6 (9) |
4, 6 (10) |
5, 6 (11) |
6, 6 (12) |
|
So what is the probability of snake eyes (two 1s)? There is only 1 out of 36 possible combinations that results in two 1s. So the probability of snake eyes is 1/36.
What is the probability of rolling a 7? If you look carefully, you will see that six different combinations will produce a 7, so the probability of a 7 is 6/36 or 1/6 (dividing both numerator and denominator by 6) or .1667 (expressing the probability as a proportion).
We can produce the same kind of graph as before for each of the various totals from rolling two dice. Instead of just 6 possibilities, we have 11 (2 through 12). The figure below shows the probability of each of the 11 total scores (2 through 12).

Note two things about this graph compared to the graph for a single die. The first is that the probability of the 11 possible scores is no longer the same. A score of 7 is most likely, and scores of 2 and 12 are least likely. Second, the distribution that we get from rolling two dice is symmetric.
Addition and Multiplication Rules of Probability
We have actually been using two rules of probability in our discussion so far, but we have not formally identified them. The multiplication rule of probability states that if two events are unrelated to one another, then the probability of their joint occurrence is equal to the product of their individual probabilities.
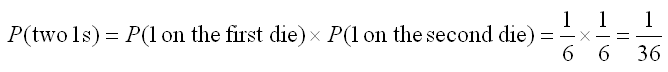
Rolling two dice represents two unrelated events, because the score on one die is unaffected by the score on the other die. That is what independent means. Therefore, the probability of scoring a 1 and 1 on the two dice is the probability of getting 1 on the first die times the probability of getting 1 on the second die.
The letter P is traditionally used to indicate a probability, with the nature of the event specified in parentheses following the P. So the formula below would read "The probability of two 1s is equal to the probability of 1 on the first die times the probability of 1 on the second die. Note that the multiplication rule only works when the two events are unrelated to one another (i.e., independent).
The addition rule of probability states that the probability of one or another event occurring is equal to the sum of the probabilities of each event. We used that rule to determine that our unusual die (the one with number 1 on two different sides) had a probability of 2/6 of rolling a number 1 (that is, 1/6+1/6).
We can use this rule in many other ways. For example, suppose your opponent rolls an 8 with two dice. What is the probability that you will win on the next roll. In other words, what is the probability that you will roll better than an 8. To determine that, we must sum the probability of rolling a 9 or a 10 or an 11 or a 12, as shown below.
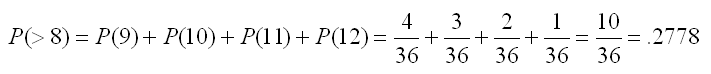
We can view the above problem in a different way. We drew a histogram of the probability of rolling each total with two dice. The height of each bar in that graph indicated the individual probability of that score. Therefore, we can think of the probability of rolling a score greater than 8 as the sum of the areas for the scores 9, 10, 11, and 12.
This is the concept that we will be using in inferential statistics. We will be introducing the use of probability with distributions in the next section and discussing the logic of extending those principles to inferential statistics in the section that follows.