 Graziano & Raulin
Research Methods (9th edition)
Effect Size
Why Use Effect Size
The primary reason to use effect size is that it is a more consistent indicator of how different the means of the groups are than the t or F statistic. This point may not be immediately obvious, but can be easily illustrated with a simple example. \
Suppose that we have two independent groups of participants and that the means for those two groups are 50 and 60 with a standard deviation of 20 in each group. The effect size is .50 [(50-60)/20]. If we have 5 participants in each group, the t will be 0.79. If we have 10 participants in each group, the t will be 1.12. If we have 30 participants in each group, the t will be 1.90. If we have 100 participants in each group, the t will be 3.54. In other words, if the mean difference and the distribution of scores are unchanged, the size of the t statistic will increase as the sample size increases. In fact, any difference between groups, no matter how trivial, will become statistically significant IF you have large enough sample sizes.
Statistical significance simply says that the differences are large and stable enough to suggest that those same differences exist in the population from which the participants were sampled. How meaningful or useful those differences are will depend on the size of the differences. That is what the effect size measures. The effect size is essentially a measure of the average difference between means expressed in standard deviation units.
Computing Effect Size With Two Groups
The exact formulas for computing the effect size will vary depending on the design of the study. We will give you the formulas for relatively simple designs below. We encourage you to consult an advanced statistical texts if you need to compute effect size for more complex designs.
If you have two independent groups and you compute a t-test, the following formula will compute your effect size for you.
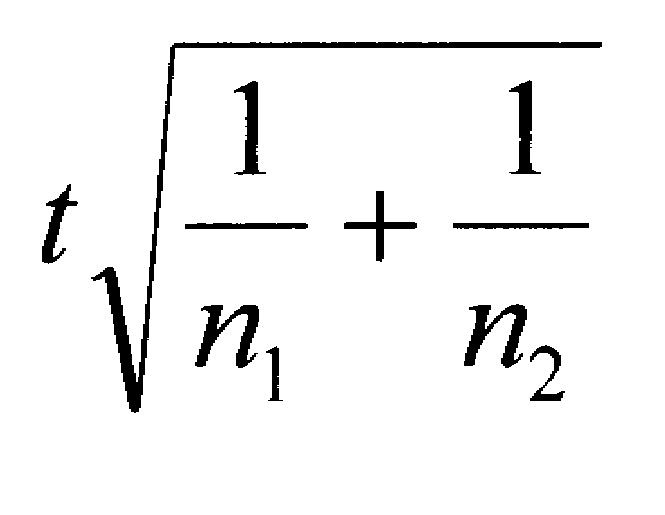
You may find it instructive to use this formula to compute the effect size for the sample sizes and the t-values noted above. You will discover that in each case, the effect size is .50, just as we computed by using the means and standard deviations.
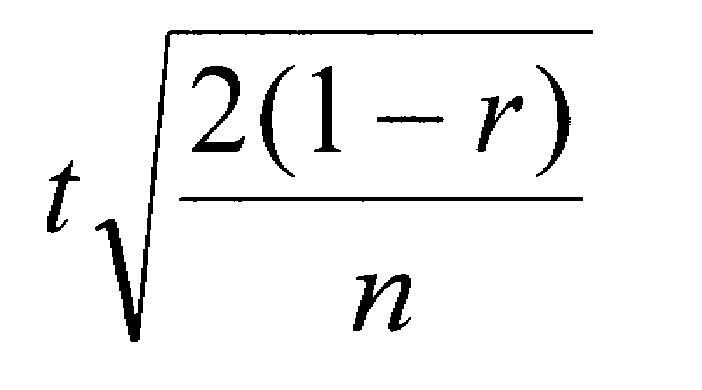
When you are using a within-subjects or matched-subjects design with two conditions, you would use a correlated-samples t-test. You would compute the effect size with the following formula, which takes into account how correlated the samples are (r).
Computing Effect Size with Several Groups
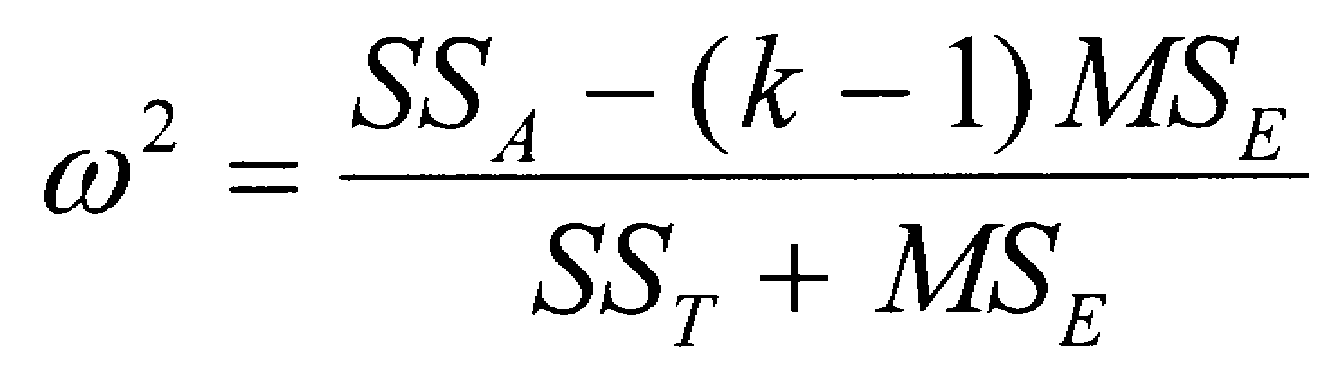
When there are several groups, we use a different approach to computing an effect size. With multiple groups, we compute an omega squared (written w2). This index of effect size no longer refers to the average distance between means expressed in standard deviation units, but rather represents the proportion of variance in the dependent variable that is accounted for by the independent variable. That language may sound familiar, because we computed a similar index (r2, known as the coefficient of determination) for correlation coefficients. If w2 is equal to zero, it indicates that the independent variable had no effect on the dependent variable. Therefore, the means are equal. The maximum size of w2 is 1.00, which means that the independent variable completely accounts for the scores of the dependent variable. If you have several independent groups and compute a one-way ANOVA, you can compute w2 using the formula below. SSb is the Sum of Squares between groups; SST is the Sum of Square total; k is the number of groups; MSE is the error term for the ANOVA.
There are also ways to compute effect size for more complex designs, but the procedures are beyond the level of this text. Fortunately, many statistical analysis packages can routinely produce measures of effect size as an option when performing inferential statistics.