 Graziano & Raulin
Research Methods (9th edition)
Correlated Samples t-Test
The correlated samples t-test, also called the direct difference t-test, compares scores from two conditions in a within-subjects design or two groups in a matched-subjects design. The formula shown here uses values that you have already learned to compute: Means, Variances and Standard Deviations, and a product-moment correlation.
In this example, anxiety ratings were made before and after a brief treatment session. The ratings range from 1 (no anxiety) to 5 (extreme anxiety). Pretest and posttest ratings of anxiety are made on 91 subjects. Listed here are the summary statistics computed from the raw data.
| Group 1 | Group 2 | |
| Mean | 3.17 | 2.96 |
| Standard Deviation | 0.893 | 0.975 |
| Sample Size | N = 91 | |
| Correlation | r = 0.84 | |
Use the formula below to compute the value of t.
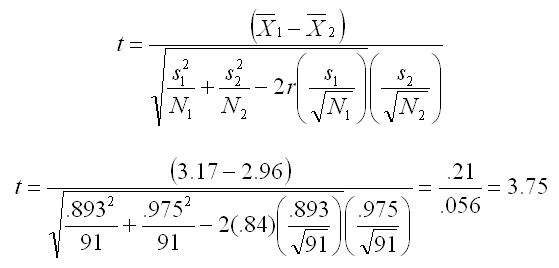
Look up the critical value of t (df = number of pairs - 1 = 91 - 1 = 90). With an alpha of 0.05, the critical value of t is between 1.98 and 2.00. Because the observed t (3.75) exceeds the critical value, we reject the null hypothesis and conclude that the treatment produced a significant reduction in anxiety.