 Graziano & Raulin
Research Methods (9th edition)
Spearman Rank-Order Correlation
The Spearman rank-order correlation quantifies the degree of linear relationship between two variables that produce ordered data. However, it can also be used with one variable that produces score data and a second variable that produces ordered data. The only thing that you have to do is to convert the scores on the variable that produces score data into ranks (essentially converting the measure to ordered data).
This example includes class ranks (ordered data) and achievement test scores (score data) from 20 students. The class ranks are already ranks, but the achievement test scores must be converted to ranks to compute the Spearman rank-order correlation. So there are several steps that must be done to compute the rank-order correlation.
- Set up columns for both the X and Y variables (class ranks and achievement test scores, respectively).
- Convert the achievement test scores to ranks by giving the person with the highest achievement score a rank of 1, the person with the next highest a rank of 2, and so on. If you have tied scores, you average the ranks for those tied scores. For example, the second and third highest achievement score is 700, so we average the ranks [(2+3)/2 = 2.5] and give that rank to both of the people with that achievement score.
- Set up two additional columns: One column is the difference between the ranks and the second is the square of that difference.
- Sum the squared differenced column to get the value needed for the formula. You may also want to sum the difference column as a mathematical check. If you have made no computational errors, the difference column should sum to zero.
Student |
(X) Class Rank |
Achievement Test Scores |
(Y) Ranks for Achievement Test Scores |
(X-Y) d |
d2 |
| A | 12 | 440 | 14 | -2.0 | 4.00 |
| B | 8 | 580 | 8 | 0 | 0 |
| C | 15 | 400 | 16 | -1.0 | 1.00 |
| D | 1 | 740 | 1 | 0 | 0 |
| E | 3 | 700 | 2.5 | 0.5 | 0.25 |
| F | 20 | 280 | 20 | 0 | 0 |
| G | 10 | 520 | 9.5 | 0.5 | 0.25 |
| H | 2 | 700 | 2.5 | -0.5 | 0.25 |
| I | 9 | 500 | 11 | -2.0 | 4.00 |
| J | 6 | 660 | 5 | 1.0 | 1.00 |
| K | 16 | 440 | 14 | 2.0 | 4.00 |
| L | 4 | 640 | 6 | -2.0 | 4.00 |
| M | 11 | 520 | 9.5 | 1.5 | 2.25 |
| N | 5 | 680 | 4 | 1.0 | 1.00 |
| O | 14 | 460 | 12 | 2.0 | 4.00 |
| P | 17 | 320 | 18 | -1.0 | 1.00 |
| Q | 7 | 600 | 7 | 0 | 0 |
| R | 19 | 300 | 19 | 0 | 0 |
| S | 13 | 440 | 14 | -1.0 | 1.00 |
| T | 18 | 340 | 17 | 1.0 | 1.00 |
| Totals | 0 | 29.00 |
Compute the Spearman rank-order correlation using the formula shown below. The only values you need is the sum of the squared differences and the sample size. The Spearman rank-order correlation is typically listed as rs, where the subscript "s" indicates that you have a Spearman correlation.
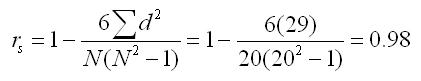
The critical value of rs is found in a Spearman Rank-Order Coefficient Table. If we assume an alpha of 0.01, the critical rs is 0.591 (N = 20). We conclude that there is a significant linear relationship between class ranking and achievement test scores in the population from which the sample is drawn.